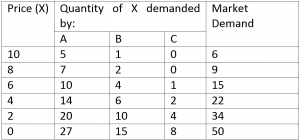
The total quantity which all the consumers of a commodity are willing to buy at a given price peer time unit, other things remaining the same, is known as market demand for the commodity. In other words, the market demand for a commodity is the total of individual demands by all the consumers (or buyers) of the commodity at a point in time and a t given price, other factors remaining same. For instance, suppose there are three consumers (viz, A, B, C) of a commodity X, and their individual demand at its different prices is as given in the table below. The last column presents the market demand, i.e., the aggregate of individual demand by three consumers at different prices.
Graphically, market demand curve is the horizontal summation of individual demand curves. The individual demand schedules plotted graphically and summed up horizontally gives the market demand curve as shown below
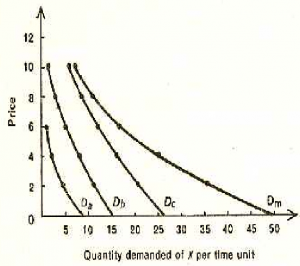
The individual demands for commodity X are given by Da, Db, Dc respectively. The horizontal summation of these individual demand curves, results into the market demand curve, Dm, for the entire commodity X. The curve Dm represents the market demand curve for commodity X when there are only three consumers of the commodity.
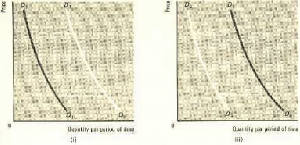
Movements along curves versus shifts of curves
It is important to distinguish between a movement along a demand curve and a shift of the whole curve. A movement along a demand curve indicates that a different quantity is being demanded because the price has changed. A shift in of demand curve indicates that a different quantity will be demanded at each possible price because something else, either incomes, tastes or the price of some other good, has changed. The change in demand is depicted in the figure below.